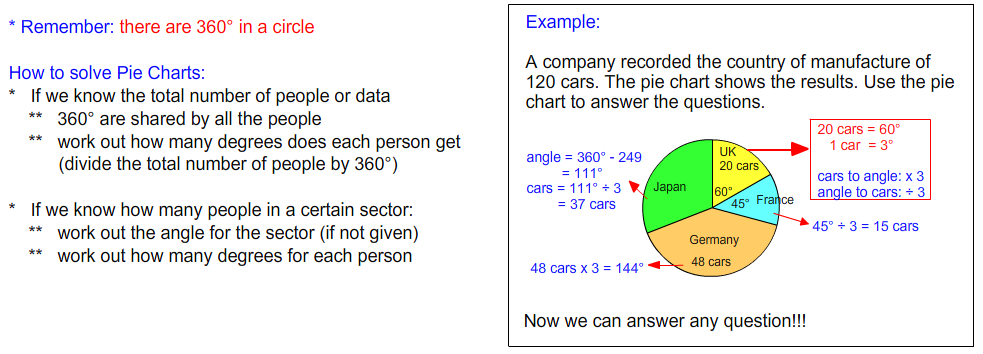
Pie Charts 1: Read and interpret pie charts
Quiz Summary
0 of 3 Questions completed
Questions:
Information
You have already completed the quiz before. Hence you can not start it again.
Quiz is loading…
You must sign in or sign up to start the quiz.
You must first complete the following:
Results
Results
0 of 3 Questions answered correctly
Your time:
Time has elapsed
You have reached 0 of 0 point(s), (0)
Earned Point(s): 0 of 0, (0)
0 Essay(s) Pending (Possible Point(s): 0)
| Average score |
|
| Your score |
|
Categories
- Not categorized 0%
- 1
- 2
- 3
- Current
- Review
- Answered
- Correct
- Incorrect
-
Question 1 of 3
1. Question
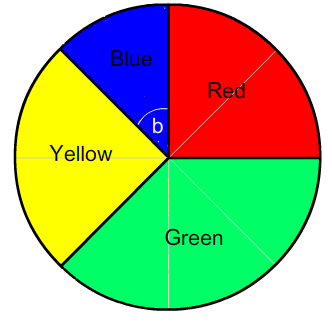
Anne asked her friends what was their favourite colour.
From her results she drew out this pie chart.
-
(a) (Give your answers in its simplest form.)
What fraction of her friends preferred
(i) red?
(ii) blue?
(b) 32 of her friends liked yellow best. How many preferred green?
(c) How many people did she ask in total?
(d) How big is the angle marked b? °
Correct / 5 PointsIncorrect / 5 Points -
-
Question 2 of 3
2. Question
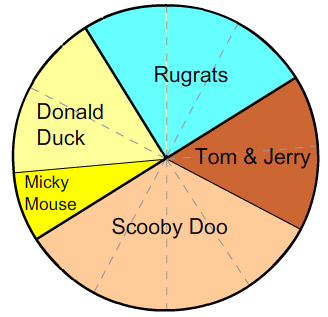
Victoria asked her friends what was their favourite cartoon.
Here are the results drawn out as a pie chart.
-
(a) Giving your answers in its simplest form, what fraction of her friends preferred
(i) Tom and Jerry?
(ii) Scooby Doo?
(b) 14 of her friends preferred Donald Duck. How many preferred
(i) rugrats?
(ii) Mickey Mouse?
(c) How many people did she ask in total?
Correct / 5 PointsIncorrect / 5 Points -
-
Question 3 of 3
3. Question
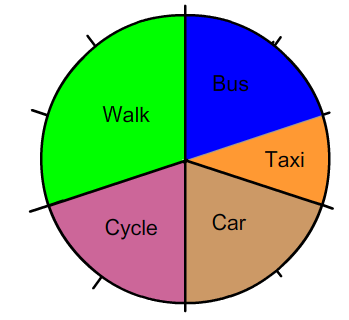
Here is a pie chart showing how pupils travel to school every day.
-
(a) What percentage travel by
(i) car? %
(ii) taxi? %
(b) What fraction travel by bus? (Answer in its simplest form.)
(c) 50 pupils cycle to school every day. How many pupils walk to school?
(d) How many pupils in the school were asked?
Correct / 5 PointsIncorrect / 5 Points -